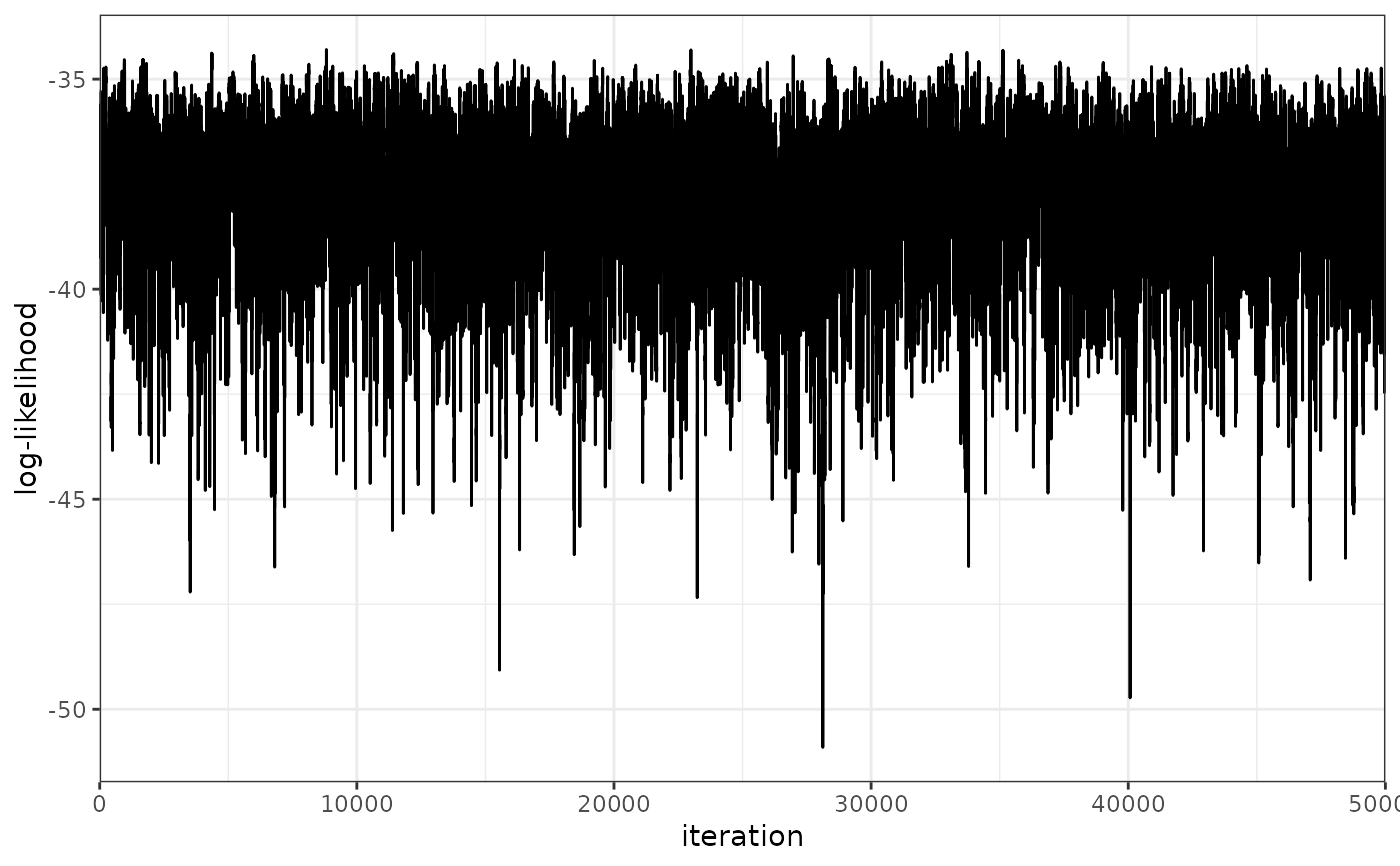
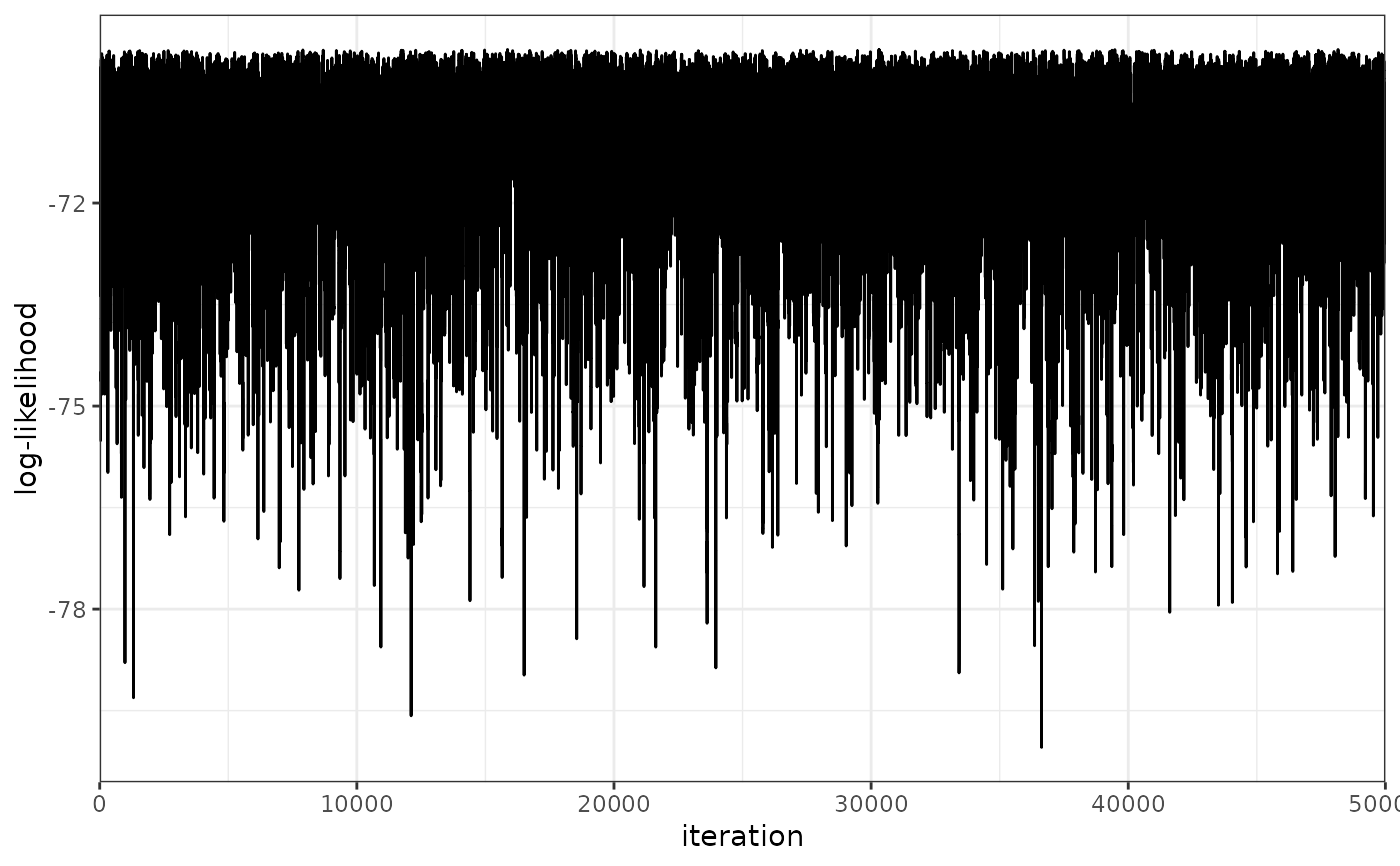
Produce MCMC trace plot of the log-likelihood at each iteration.
plot_trace(project, K = NULL, rung = NULL, col = "black", phase = "sampling")
Arguments
| project | an RgeoProfile project, as produced by the function
|
|---|---|
| K | which value of K to plot. |
| rung | which rung to plot. Defaults to the cold chain. |
| col | colour of the trace. |
| phase | plot the trace during the burnin or sampling phase |
Examples
# Similarly, plot the trace for every K value. plot_trace(project = p)#>