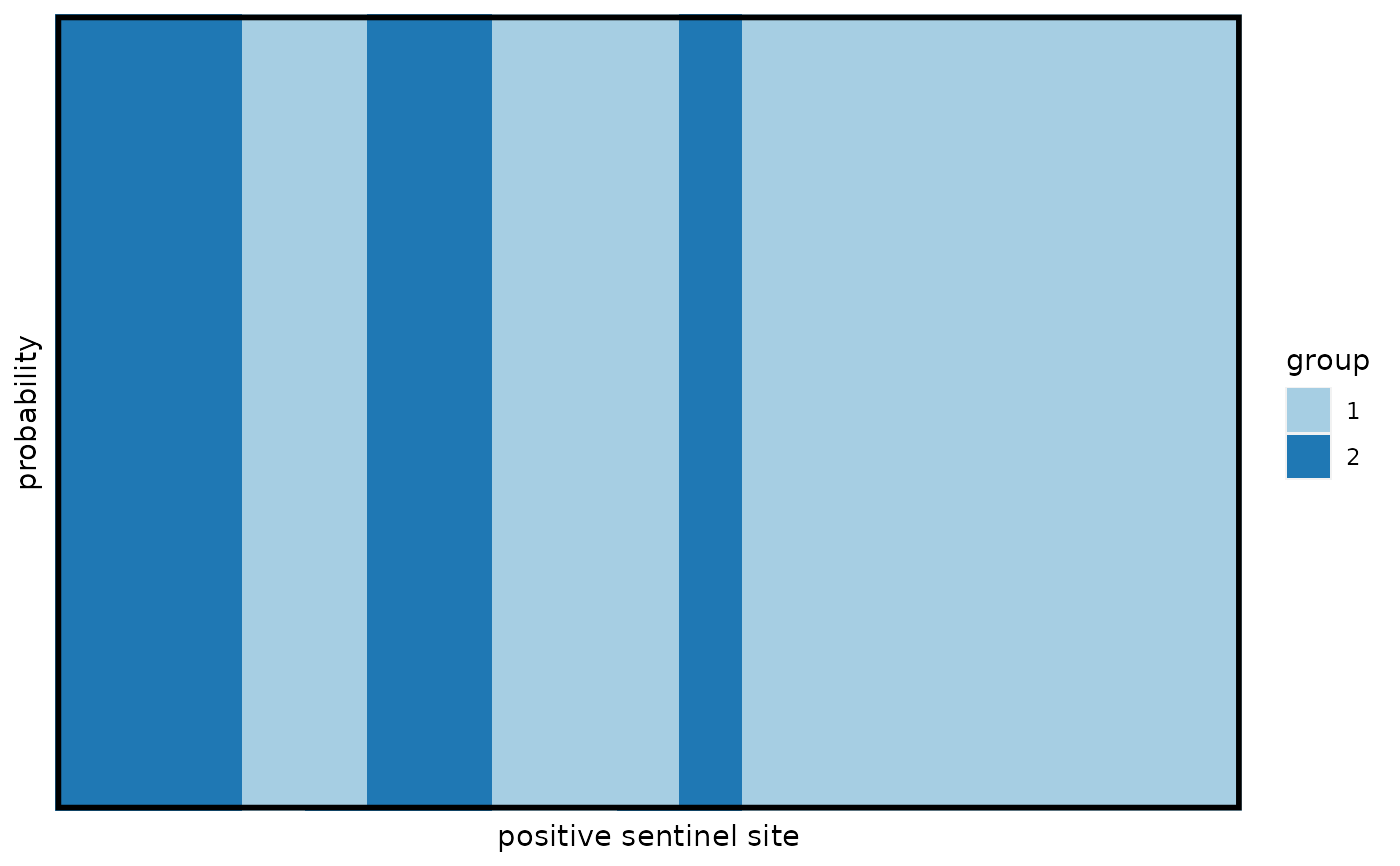
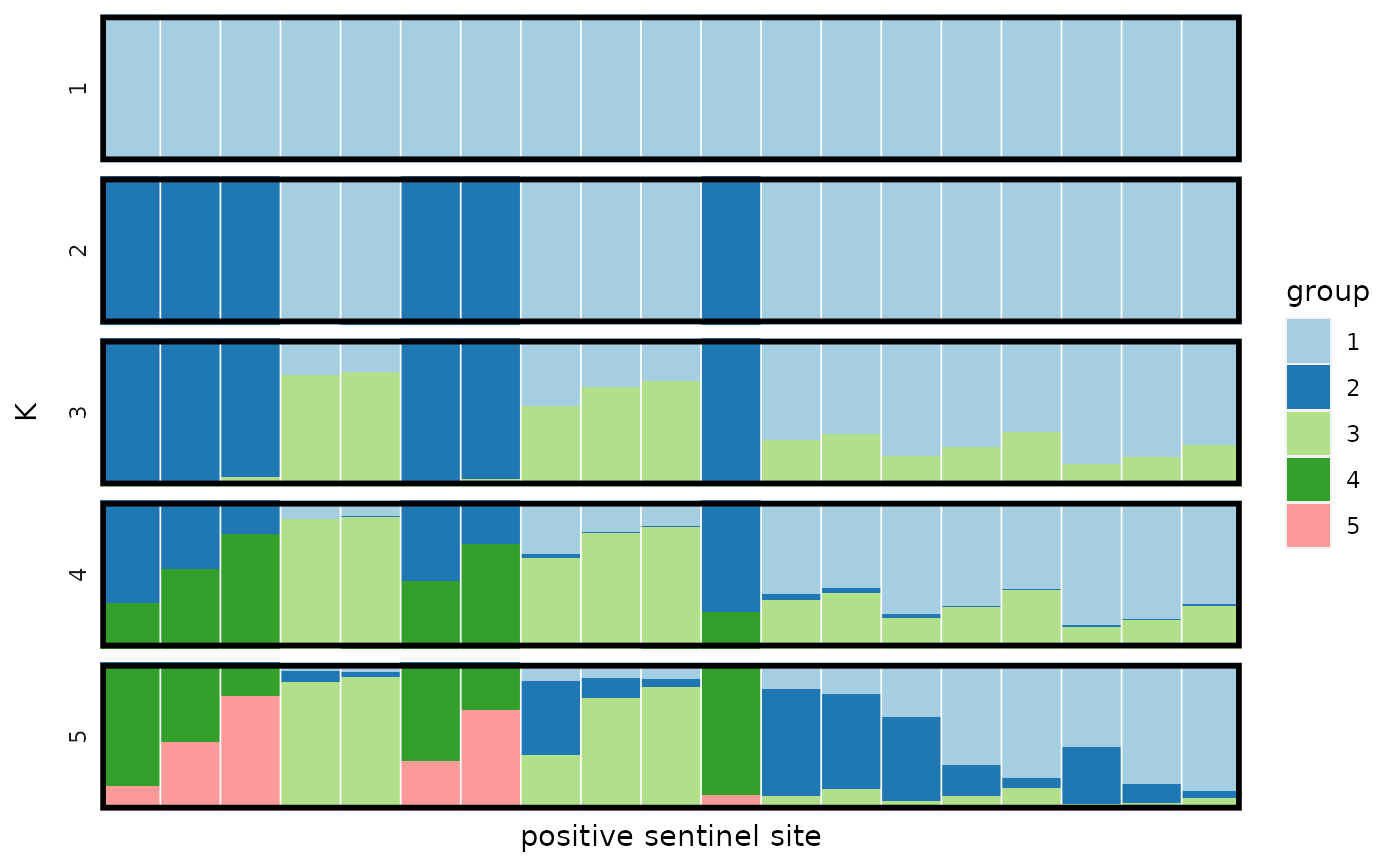
Produce posterior allocation plot of current active set.
plot_structure(project, K = NULL, divide_ind_on = FALSE)
Arguments
| project | an RgeoProfile project, as produced by the function
|
|---|---|
| K | which value of K to produce the plot for. |
| divide_ind_on | whether to add dividing lines between bars. |
Examples
p <- rgeoprofile_file("tutorial1_project.rds") # Plot the structure for a single K value. plot_structure(project = p, K = 2)# Similarly, plot the allocation structure for every K. plot_structure(project = p, divide_ind_on = TRUE)