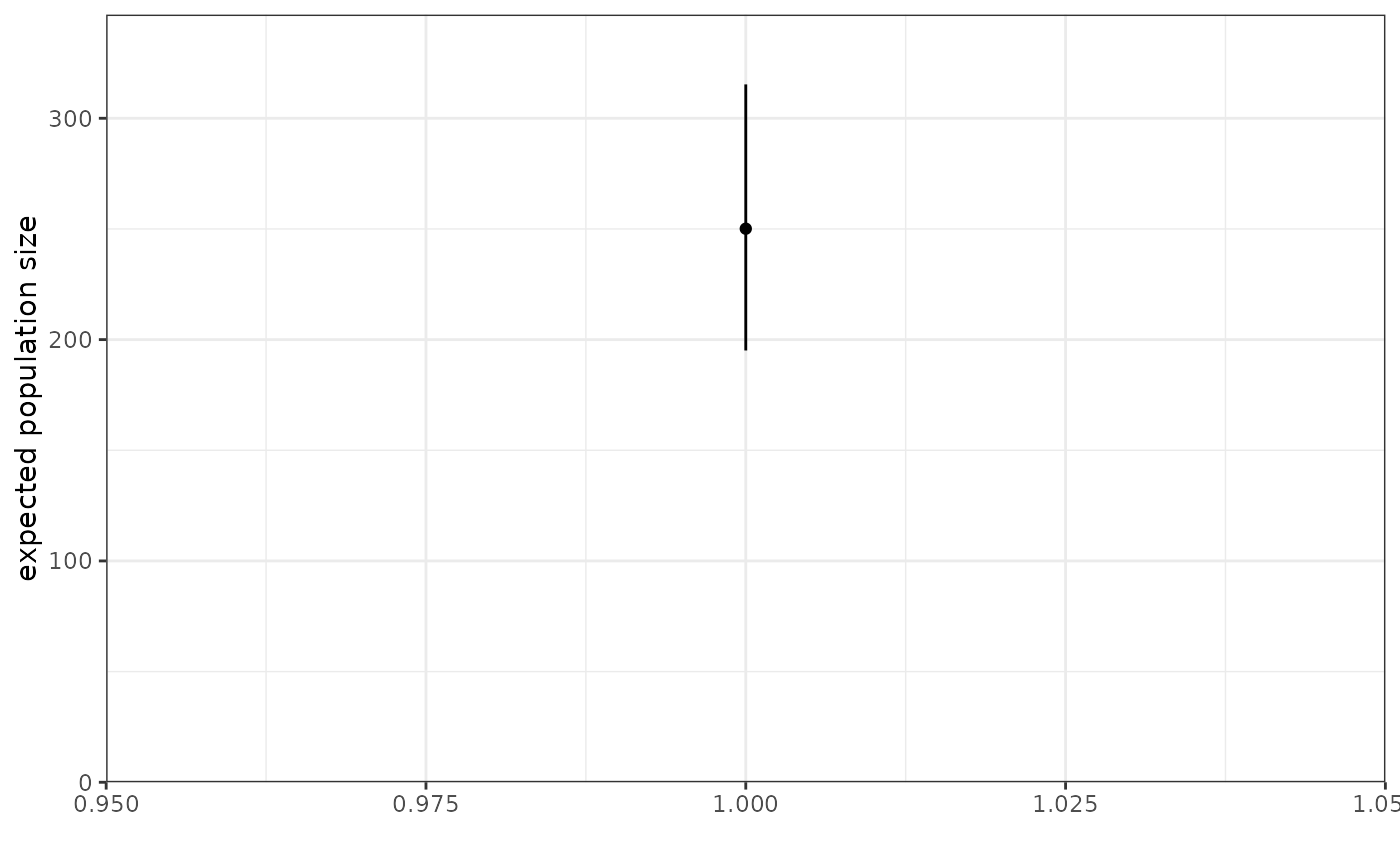
Plot credible intervals for the entire expected population (single) or individuals sources (independent).
plot_expected_popsize(project, K = NULL)
Arguments
| project | an RgeoProfile project, as produced by the function
|
|---|---|
| K | which value of K to produce the plot for. |